
The end of manual HR reports: storyboards that deliver insights
Every month, the same scenario: you need an overview of headcount, turnover, or retention. Hours go by because you have to pull together tables, hunt for charts, and adjust layouts – for every single report.
Until now.
Storyboards with the AI Data Analyst or via MCP
Until now, storyboards had to be built manually: adding rows, searching for elements, placing charts one by one. With the AI Data Analyst, this is now conversational and efficient. You simply say:
“Create an overview of headcount and turnover by department.”
The AI Data Analyst takes care of the rest:
- Creates the storyboard automatically
- Adds a meaningful heading
- Finds the right Discover elements
- Adds custom visualizations where needed
- Applies filters
- Delivers a direct link to the finished report
And this works for both internal users and external MCP clients through the full MCP tool surface: 11 tools are available – create, rename, add rows and elements, edit, set filters, move, resize, or remove.
Real-time feedback and automatic sidebar updates
While the AI Data Analyst builds, you see what's happening in real time: a spinner shows actions like “Adding 3 charts…”, and once it's done, a checkmark flashes. The sidebar updates automatically – the new report is instantly visible without having to reload the page.
Storytelling from the data
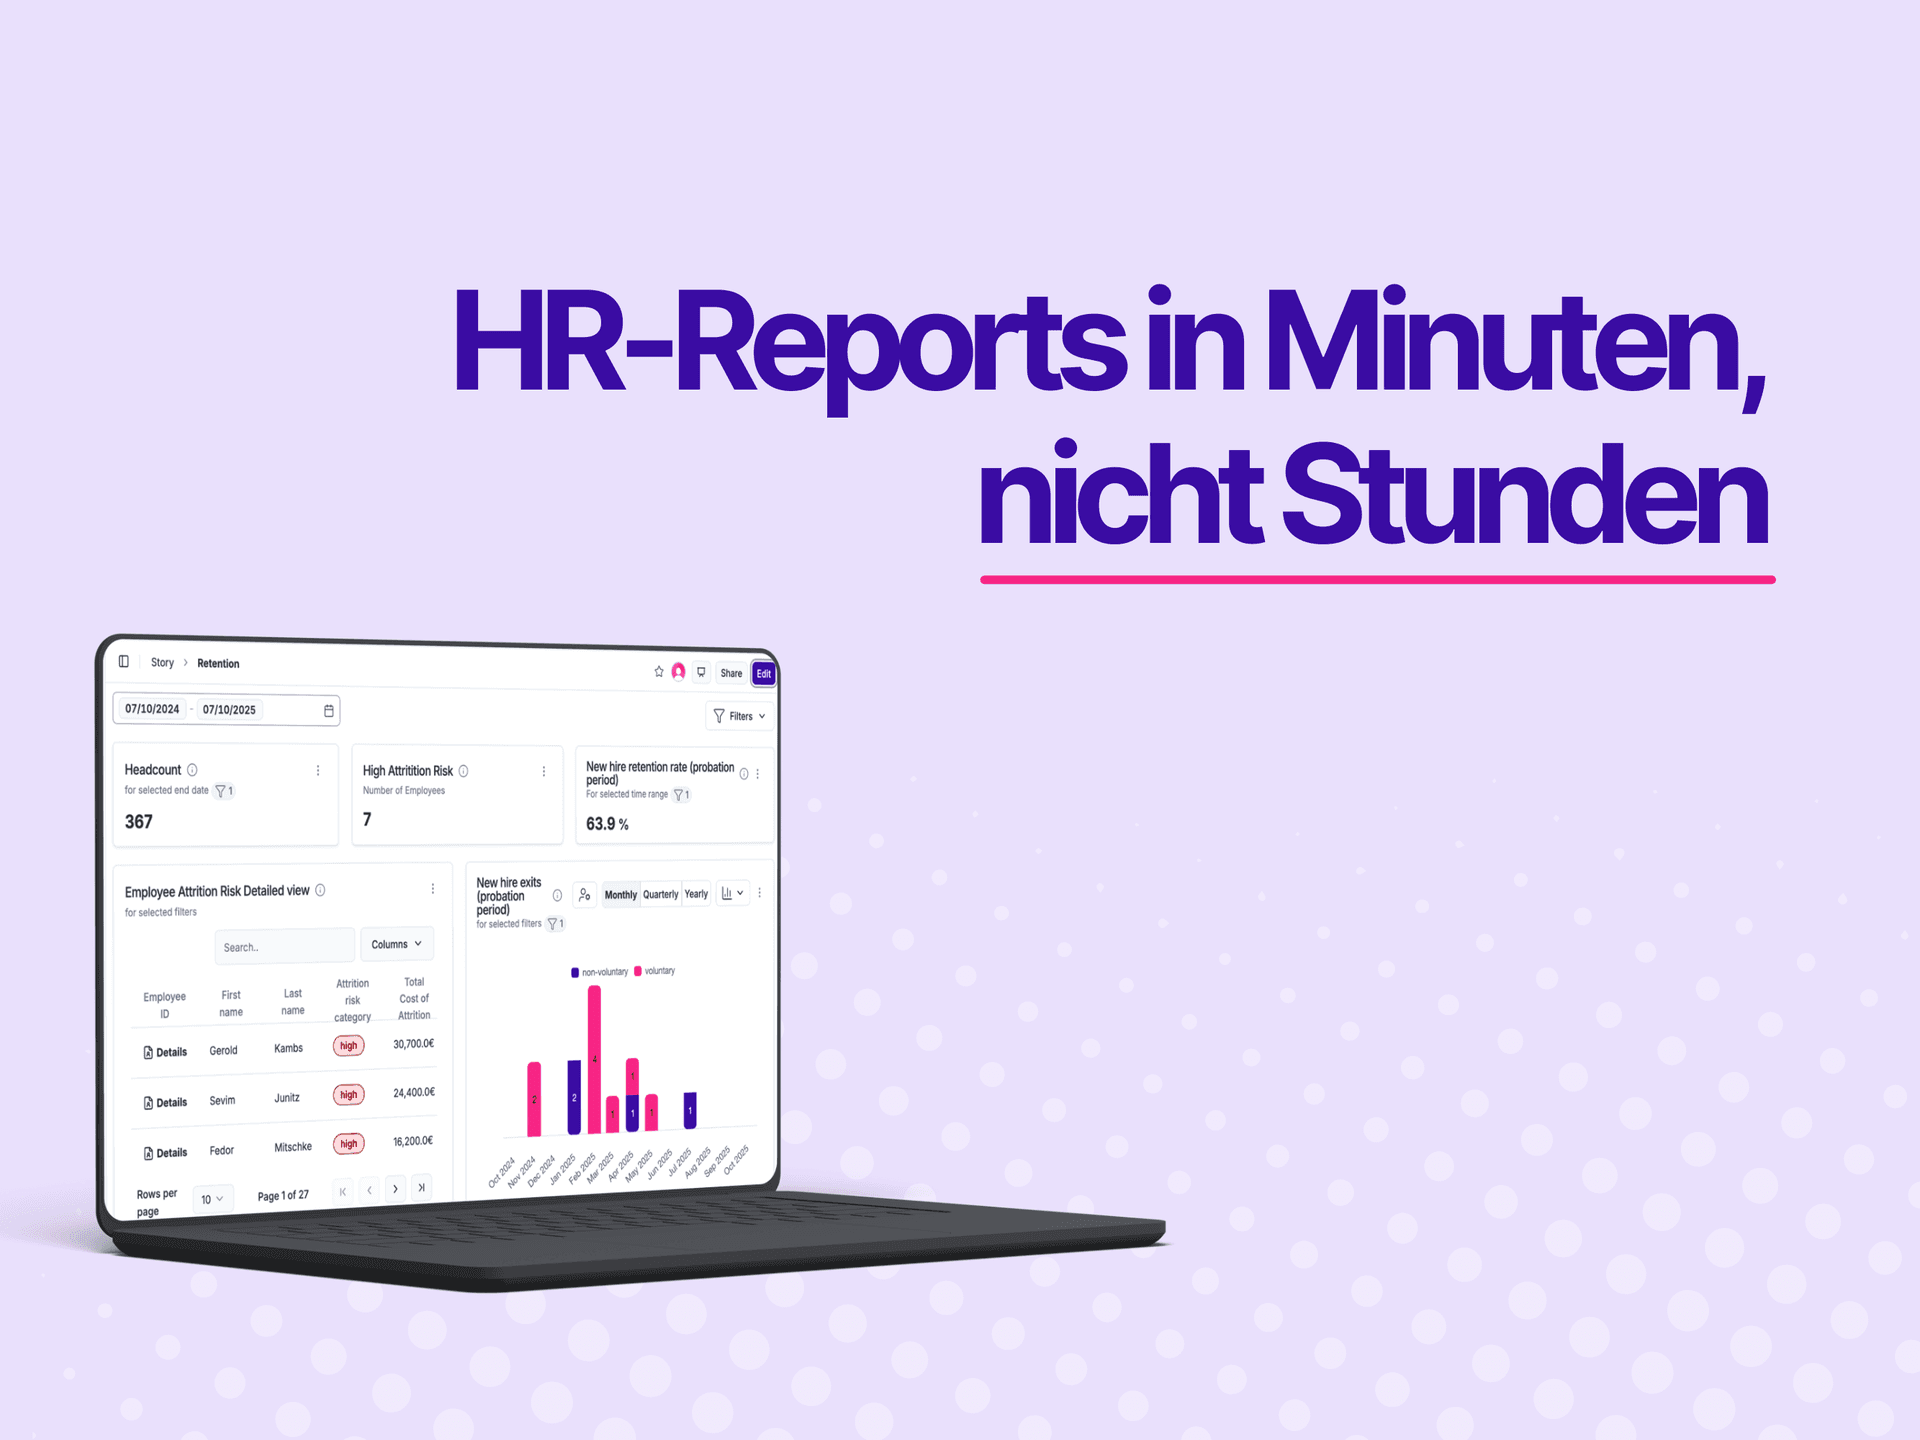
The storyboards follow an intelligent layout and structure: tables are displayed at 750px, KPIs at 155px, and the content tells a clear story. This way you immediately see trends in turnover, retention, and team development – without layout hassle.
That turns HR reports from a tedious chore into a valuable basis for decisions: you focus on the questions, the AI Data Analyst takes care of the canvas.
peopleIX – your HR data, finally usable for you.