.webp)


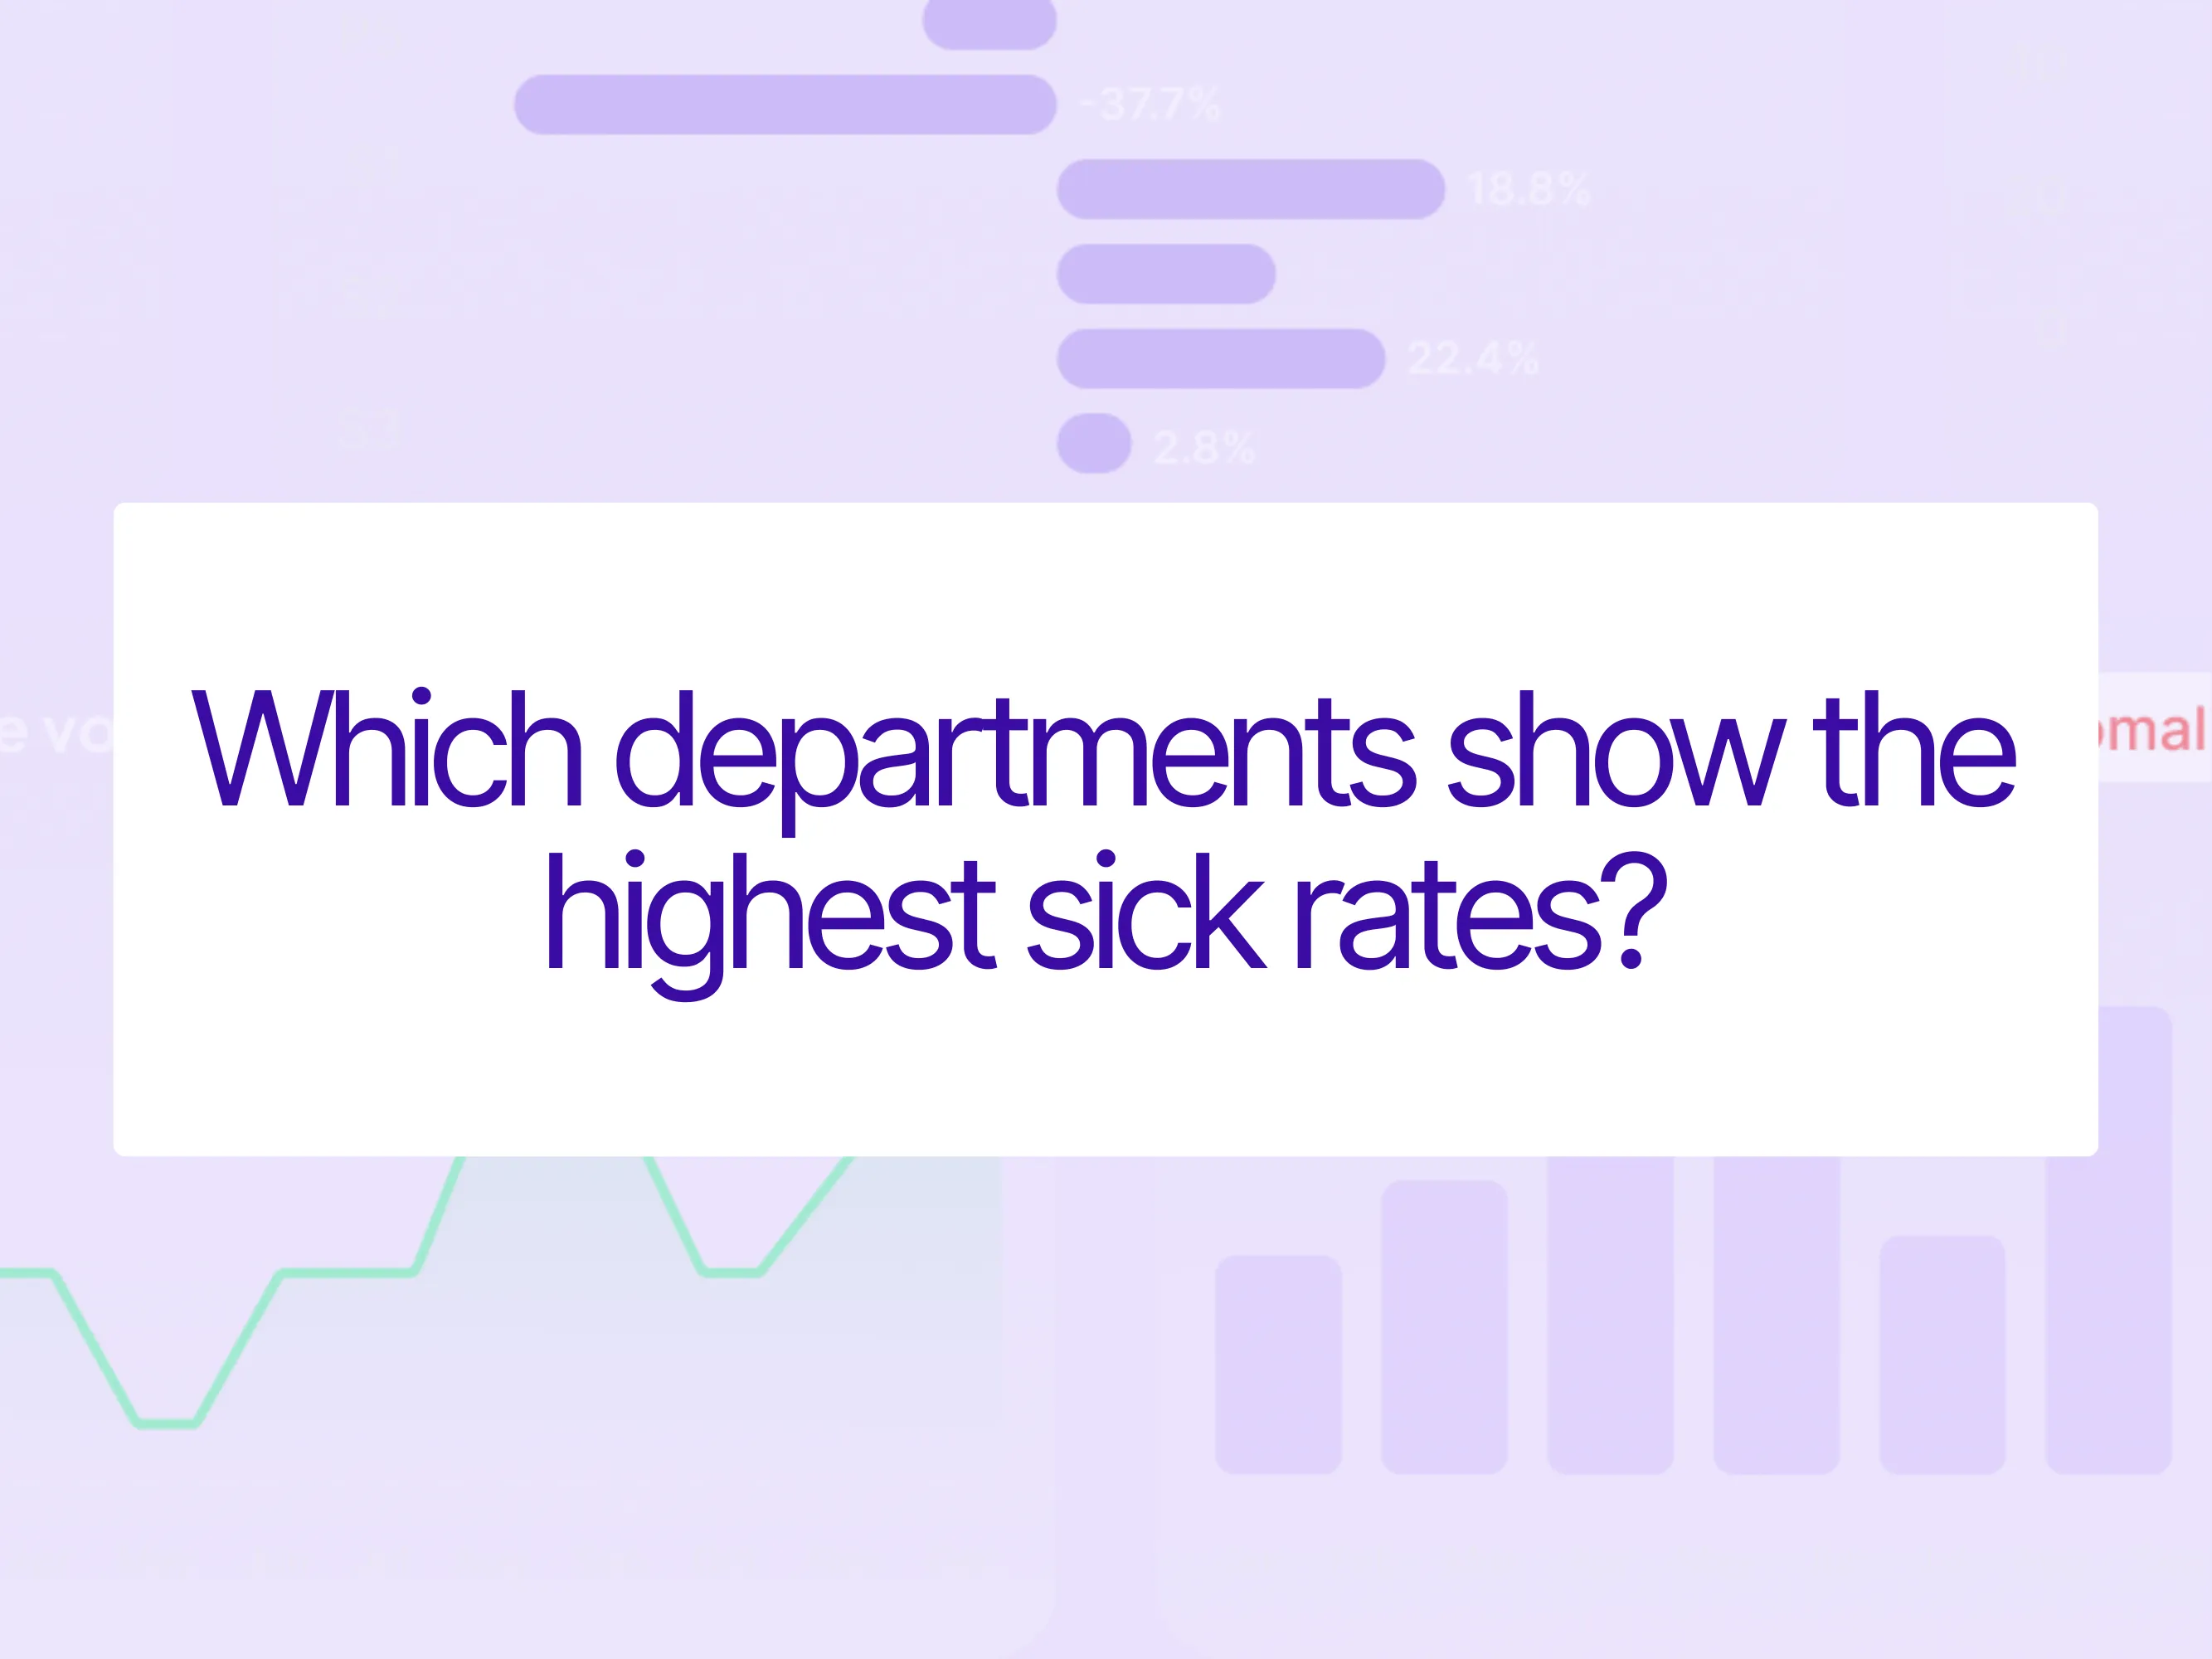
Sickness rate by department — Where is action most needed?
Health data often reveals more than meets the eye. This analysis highlights which departments have the highest sickness rates and how these values are developing relative to each other. You can quickly spot hotspots of strain, potential leadership issues, or organizational challenges. With these people analytics insights, you can design targeted measures for prevention, wellbeing, and long-term employee retention.
What does it mean to analyze which departments have the highest disease rates?
This analysis shows how cases of illness are spread across different departments.
It identifies areas with an above-average number of sick reports and thus provides important information on burdens, health trends and possible areas of action within the company.
Why that's important:
- Identify health and stress patterns: High disease rates can indicate overwork, seasonal effects, or particular health risks.
- Derive HR and management measures: Departments with high absences can be specifically supported, relieved or promoted.
- Linking productivity and wellbeing: The analysis helps to understand the balance between workload, employee health and performance and to manage it based on data.


Based on Data for the Last Year, the Following Departments Show the Highest disease rates (excluding weekends):
Top 5 Departments with the Highest Disease Rates:
- Project Management: 5.58% - well above average
- Legal and Compliance: 4.77% - also noticeably high
- Data Science: 4.59%
- Supply Chain & Procurement: 4.44%
- Finance & Accounting: 4.29%
Departments with lowest disease rates:
- Account Management: 2.05% - lowest rate
- User Experience (UX) Design: 2.20%
- Management: 2.23%
- Quality Assurance and Testing: 2.27%
Abnormalities:
Project Management Stands out clearly with an illness rate of over 5.5% - that is more than twice as high as with account management. This could indicate high work stress, project pressure, or other workplace-specific burdens.
Die The spread between departments is significant - from 2.05% to 5.58%, which suggests that department-specific factors play an important role in employee health.
Note: There is also an entry without department assignment (zero) with a very high rate of 59.6%, which may indicate data quality issues or a very small group of employees.
.webp)

.png)
.svg)
.png)


.png)