.webp)


About Lea Mikus
Lea was previously Global Director of People Strategy & Analytics at Celonis. During her time at the company, she built up analytics skills and developed successful initial use cases by creating dashboards in-house. In this article, Lea gives recommendations on how to get started with people analytics and which KPIs should be paid particular attention to.
For many companies today, it is crucial to keep an eye on the health of the organization and to recognize patterns in personnel data. Personal data is also business data. It is therefore important to have a clear picture of what an effective organization looks like and where the company currently stands in order to achieve a healthy state in the long term that promises sustainable and profitable growth.
As a first step, Lea recommends examining some basic key figures that every HR department has access to: You can see them as access to the current state of the organization. It makes sense to create a dashboard that continuously and automatically visualizes and monitors these KPIs.
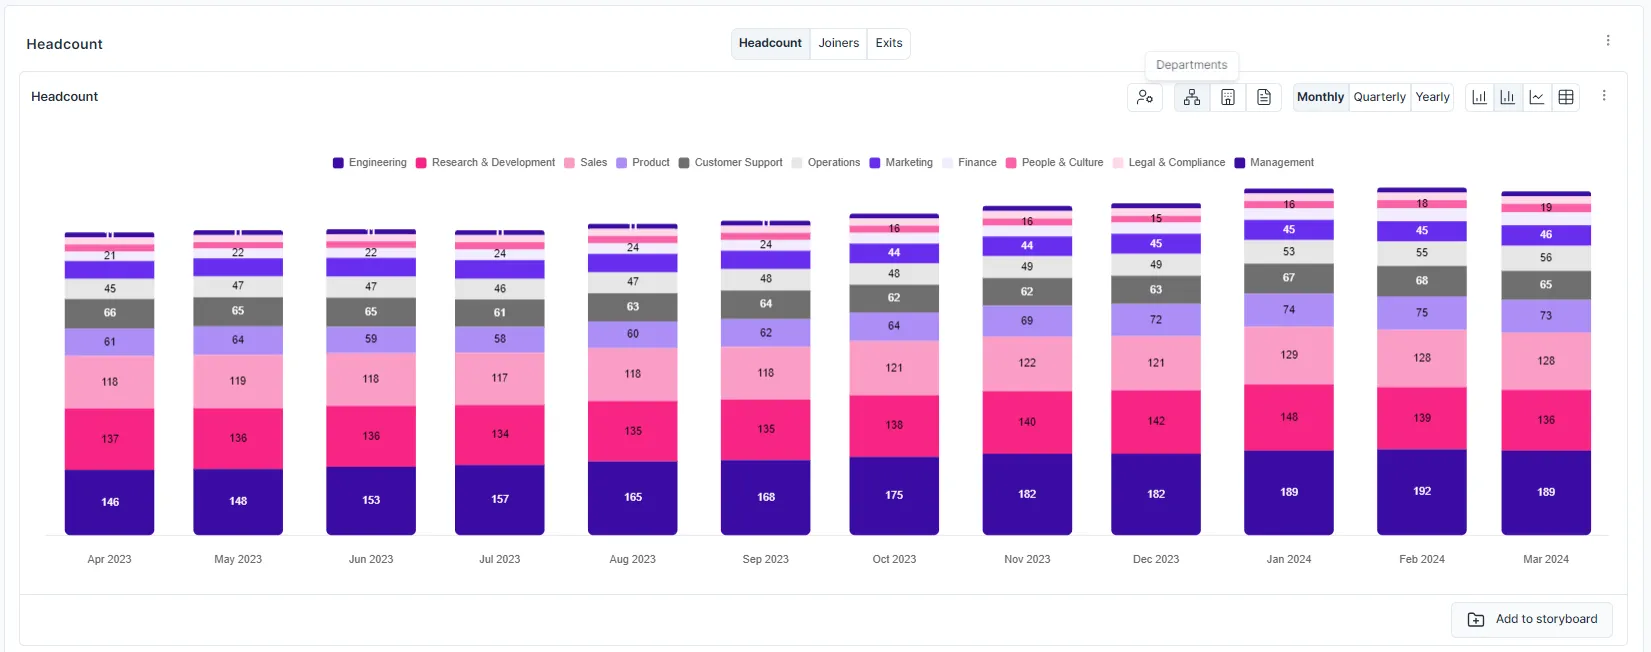
Development of the number of employees over time
By department and region, including changes in the number of employees, new hires, departures and internal changes.

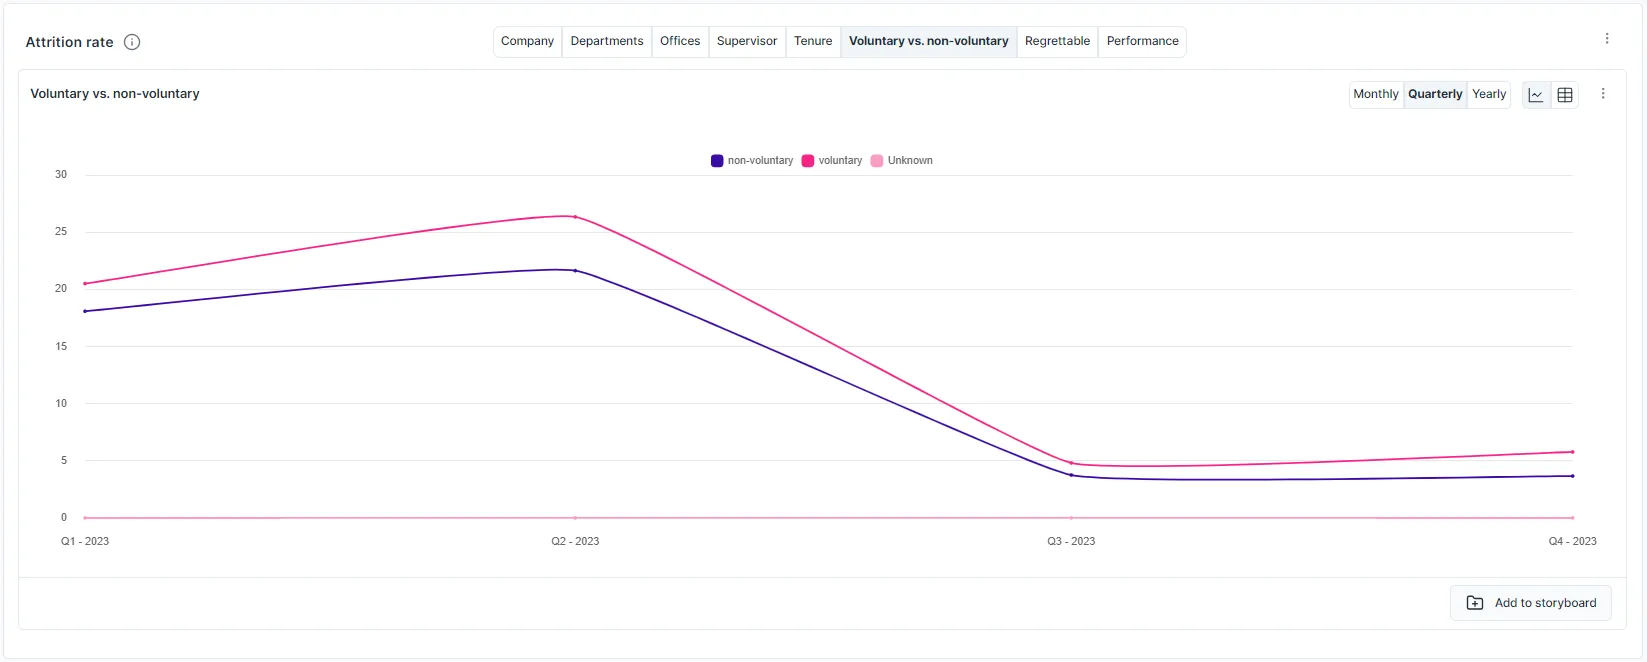
Detailed analysis of the turnover rate
Lea suggests creating a fluctuation dashboard based on two signals:
1) Measurement of voluntary vs. involuntary turnover to identify triggers for employee attrition
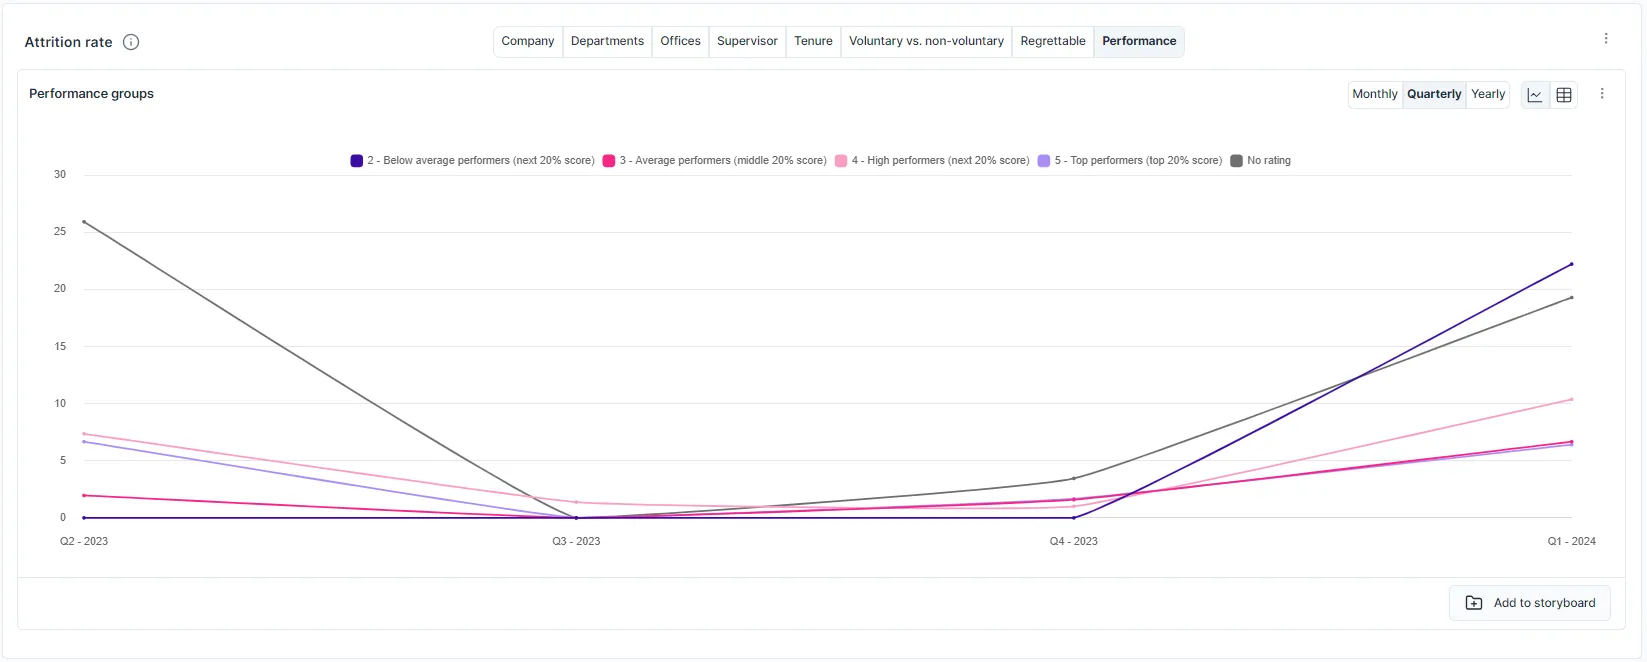
2) Turnover rate by performance group to identify issues with retaining top performers and to evaluate the effectiveness of performance management.
Distribution of employee numbers (locations, levels, departments, divisions)
Observing the distribution of employee numbers is useful in order to make evidence-based decisions for strategic direction. Data visualization helps to understand the distribution of employees, allocate resources more efficiently, and identify imbalances that strongly influence strategic planning, cost management, and HR practices.

Span of Management (Span of Control)
An important measure for ensuring efficient processes in the organization. The management span indicates in a company-specific manner how effectively managers can supervise and support their teams.

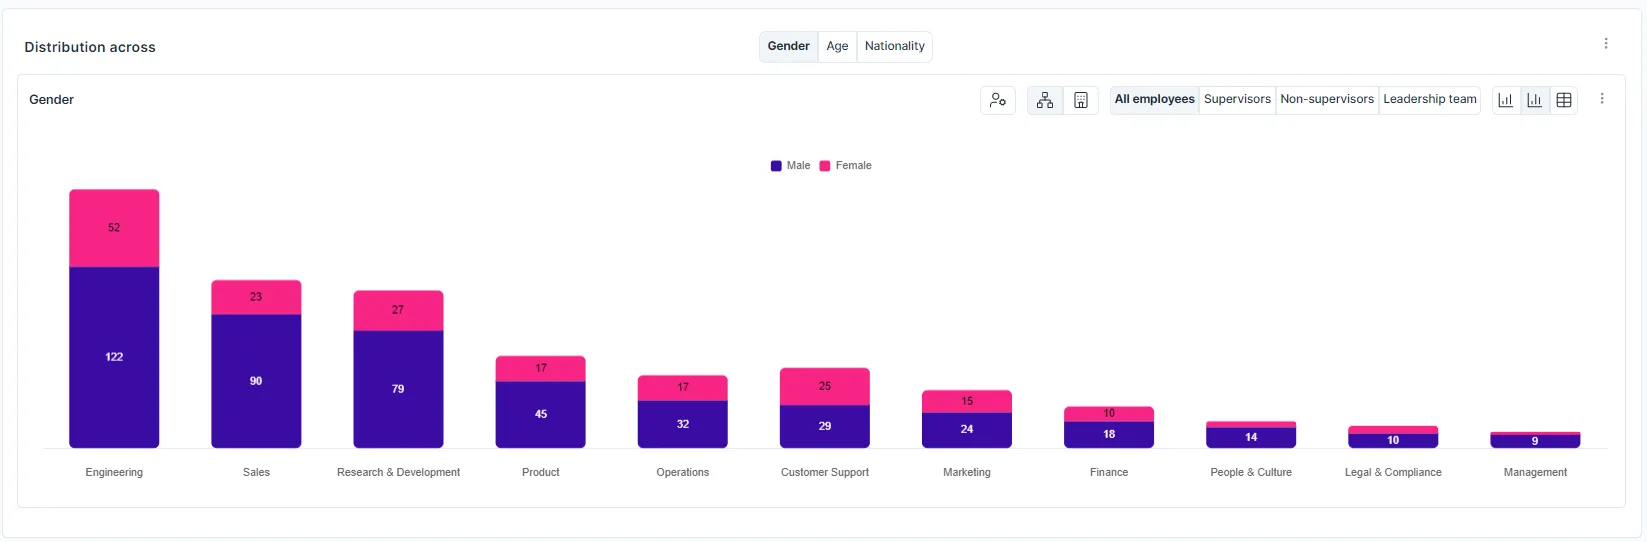
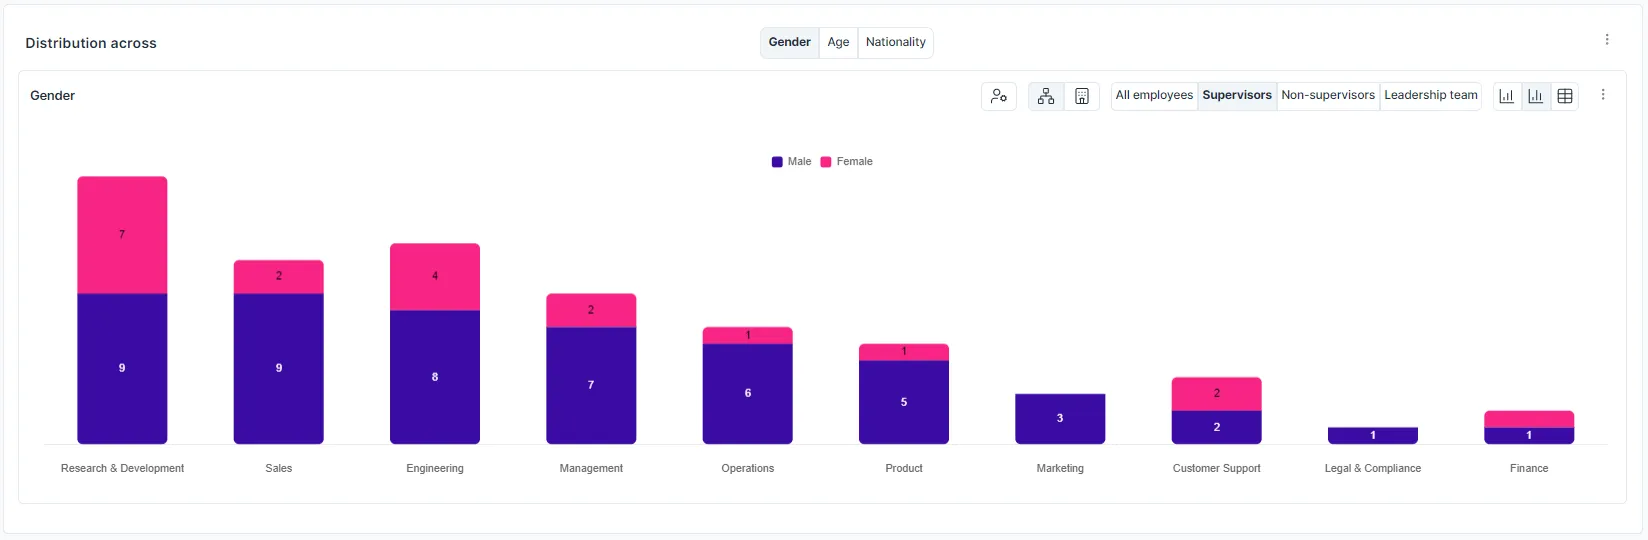
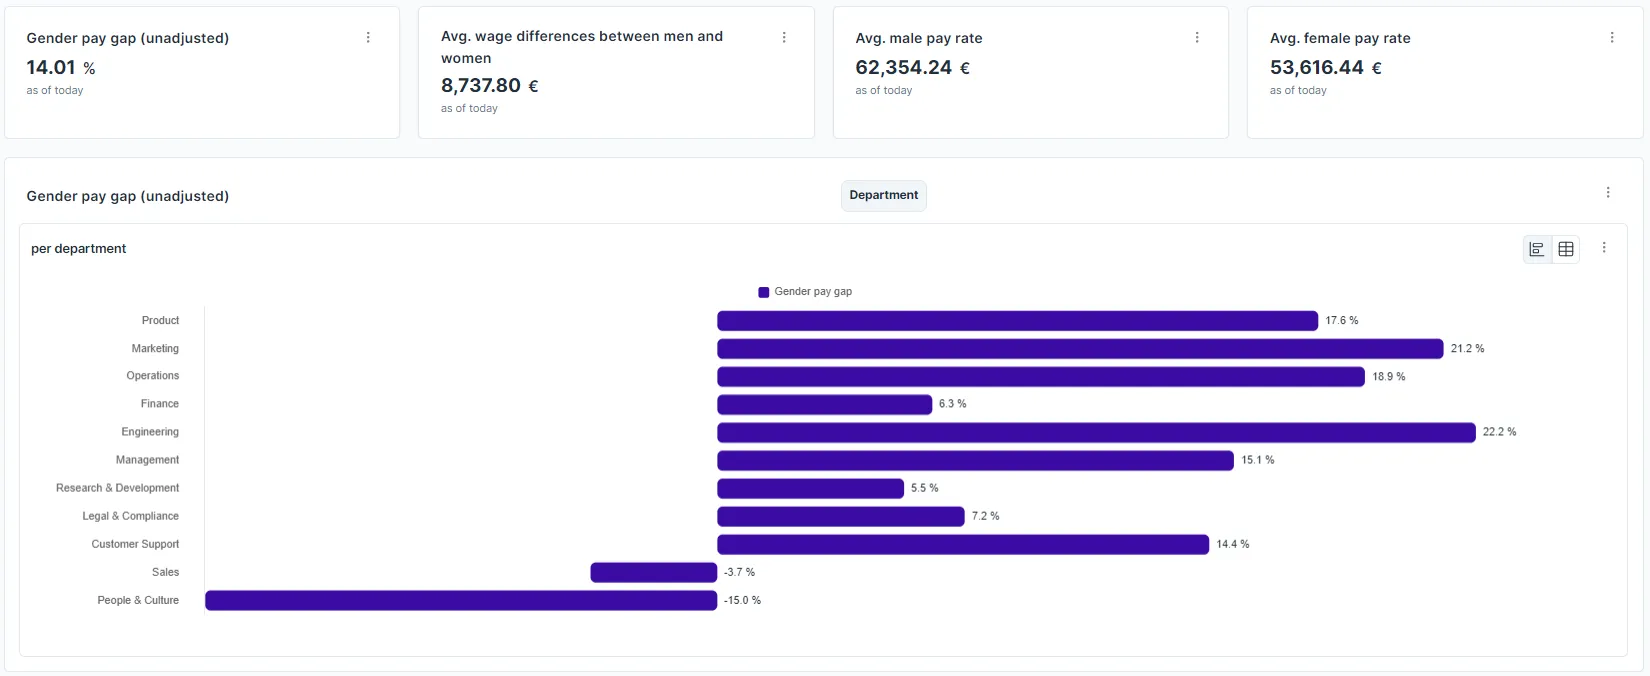
Male-to-female ratio and gender pay gap
Lea recommends understanding gender diversity in the workforce by monitoring diversity, equality and inclusion indicators. This is used to assess inclusivity and equality in the organization and to identify their impact on employee satisfaction, recruiting and retention. It is important to identify gender imbalances early on in order to proactively launch initiatives against them.
People Analytics Approach
From Lea's experience, access to the organization's personnel data is crucial to continuously gain insights, understand what works well and where improvements are needed. HR departments play a strategic role in successfully designing the organizational structure and, at the same time, business success, while ensuring that the offers are right for employees. It is important to regularly review these KPIs and data points to check whether the trends are in line with the company's talent strategy, diversity strategy, compensation strategy, etc.
A solid data base across the entire employee life cycle helps HR departments to make realistic forecasts based on these findings and to see how the organization is developing. Lea's advice is to always keep an eye on one key question: “Are the key figures and forecasts in line with your HR strategy and business goals? ”
These findings enable discussions with specialist departments, joint brainstorming on measures and prioritization according to their impact on the company. The implementation of the measures should be monitored by the business partners in the Mission Control Center.
If Lea had to summarize her people analytics approach in one sentence, it would be: “Create real added value and act as a strategic partner for the company. ”
If you would like to follow Lea's journey, feel free to contact us via linkedin connect with it.
See how you can visualize and analyze the data points mentioned by Lea with PeopleIX's Mission Control Center.
note: Celonis is not a PeopleIX customer.