.webp)


About Yasmin Ahmed
Yasmin effectively manages her organization using comprehensive people analytics. On a monthly basis, it analyses the growth of the number of employees and makes forecasts in order to gain insights into organizational development and future developments. On a quarterly basis, it evaluates key figures such as management span, turnover rates, sick days and vacation trends in departments in order to make data-based decisions for team and individual management. She also places great emphasis on diversity indicators such as gender distribution, women in management positions and equal pay in order to create awareness and promote a culture of inclusivity and transparency.
Yasmin's dashboard provides insights into:
- Organizational effectiveness and its forecast for the coming months
- Key productivity and retention indicators and how they change over time
- The impact of diversity, equity, and inclusion initiatives on the organization
What does this dashboard include?
People
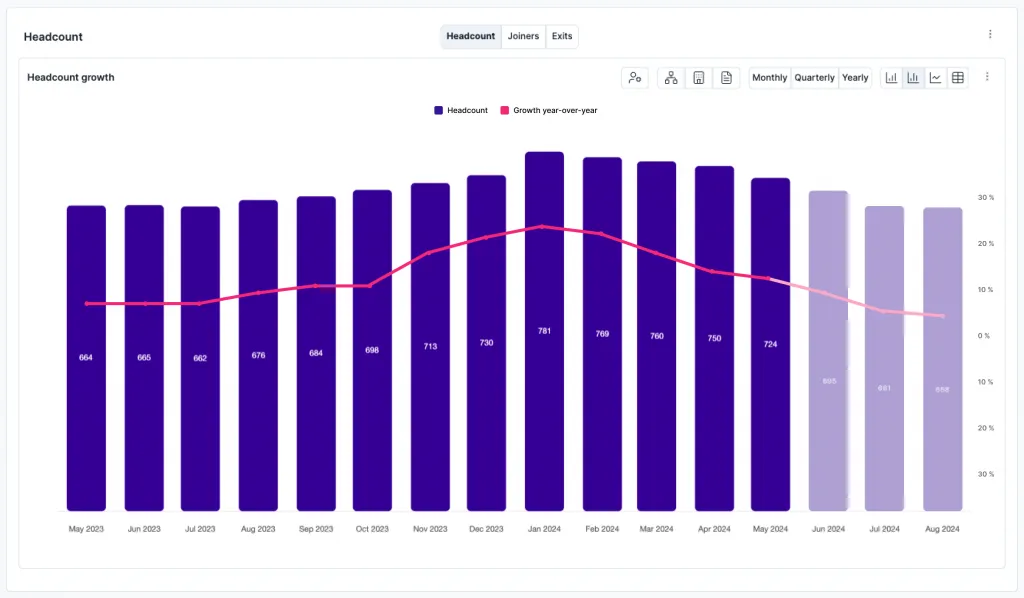
Number of employees & growth: The number of employees is the total number of active employees in an organization at a specific point in time, in this case monthly. It provides an overview of the size of the workforce and is typically used for reporting, personnel planning and organizational analyses.
Tracking provides insights into workforce size, growth, and productivity.
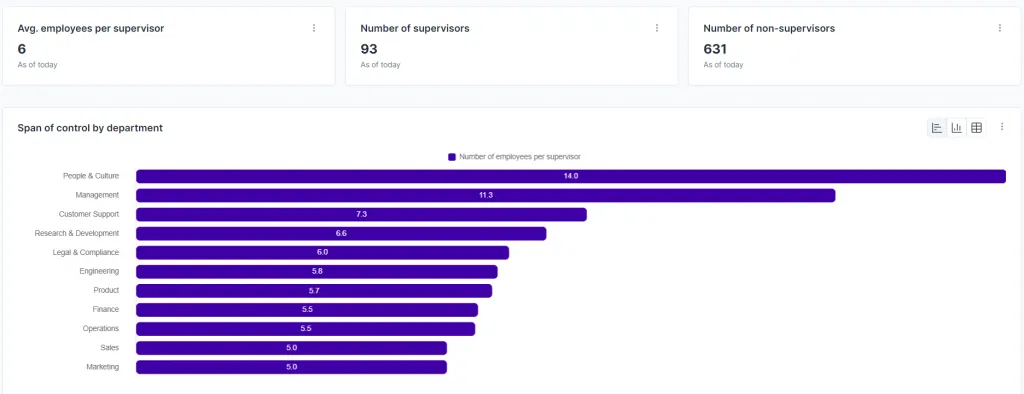
Management span: Number of employees who are directly supervised by a manager. Understanding the management span helps to evaluate organizational structure and management efficiency.
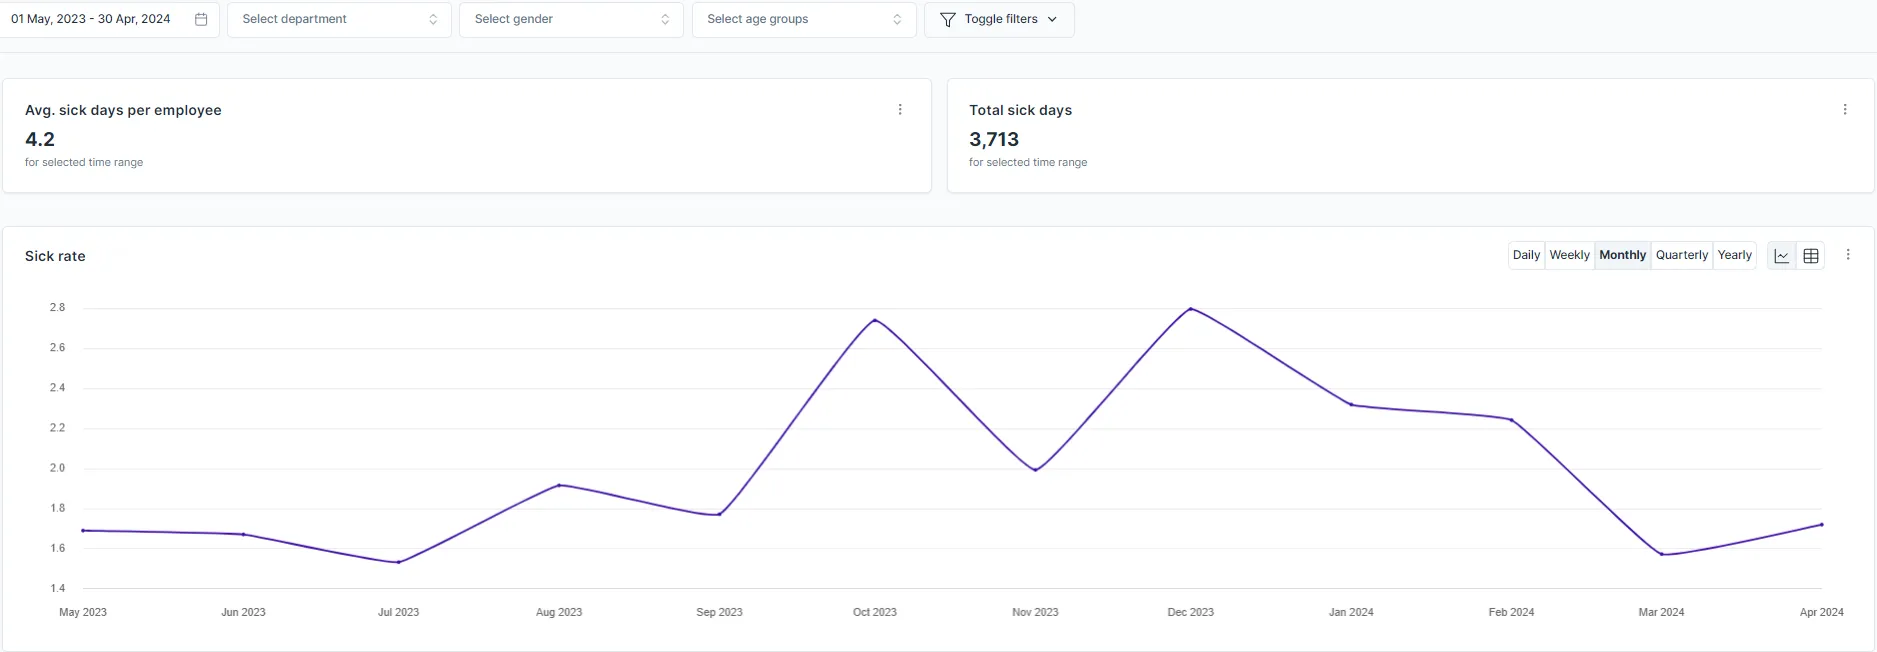
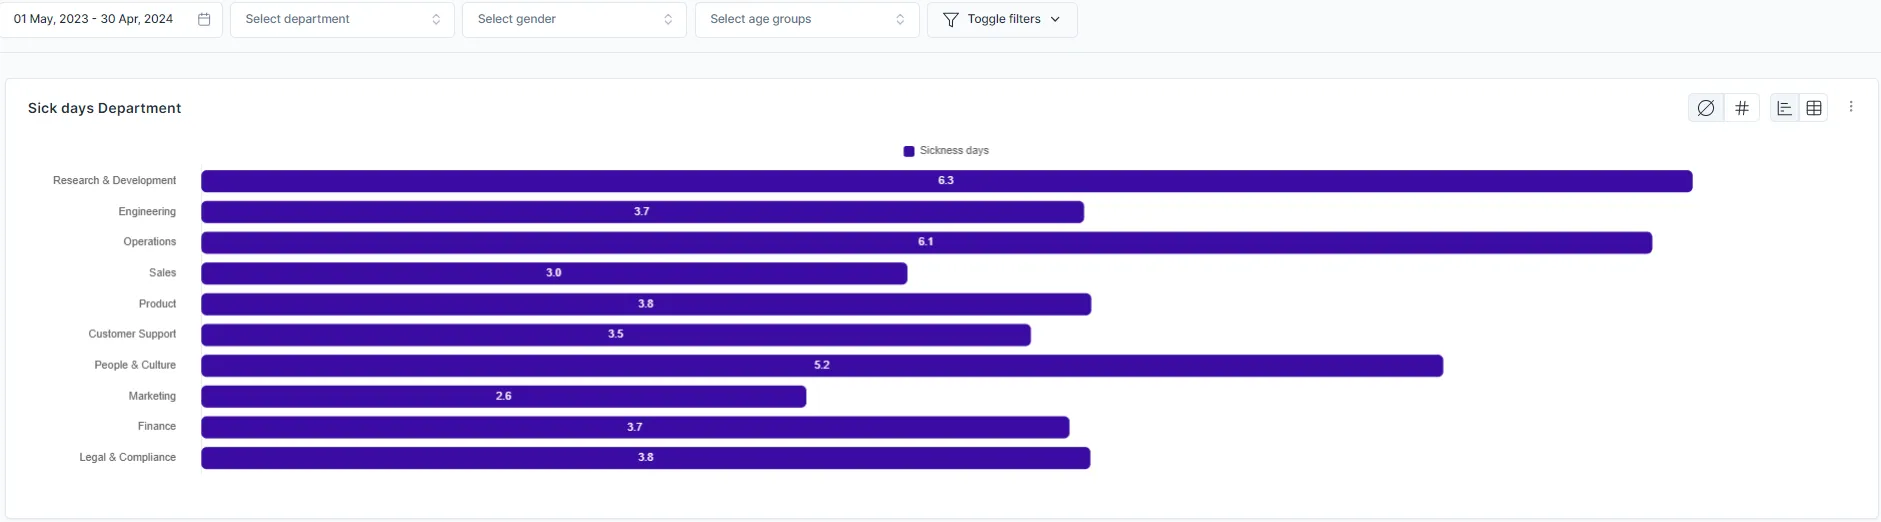
Illness rate: The sickness rate is calculated as the total number of sick days in full-time equivalents (FTE) divided by the total number of working days (FTE) to determine the proportion of sick days in total working days. This key figure provides insights into the health and well-being of the workforce by showing what percentage of working time is lost due to illness.
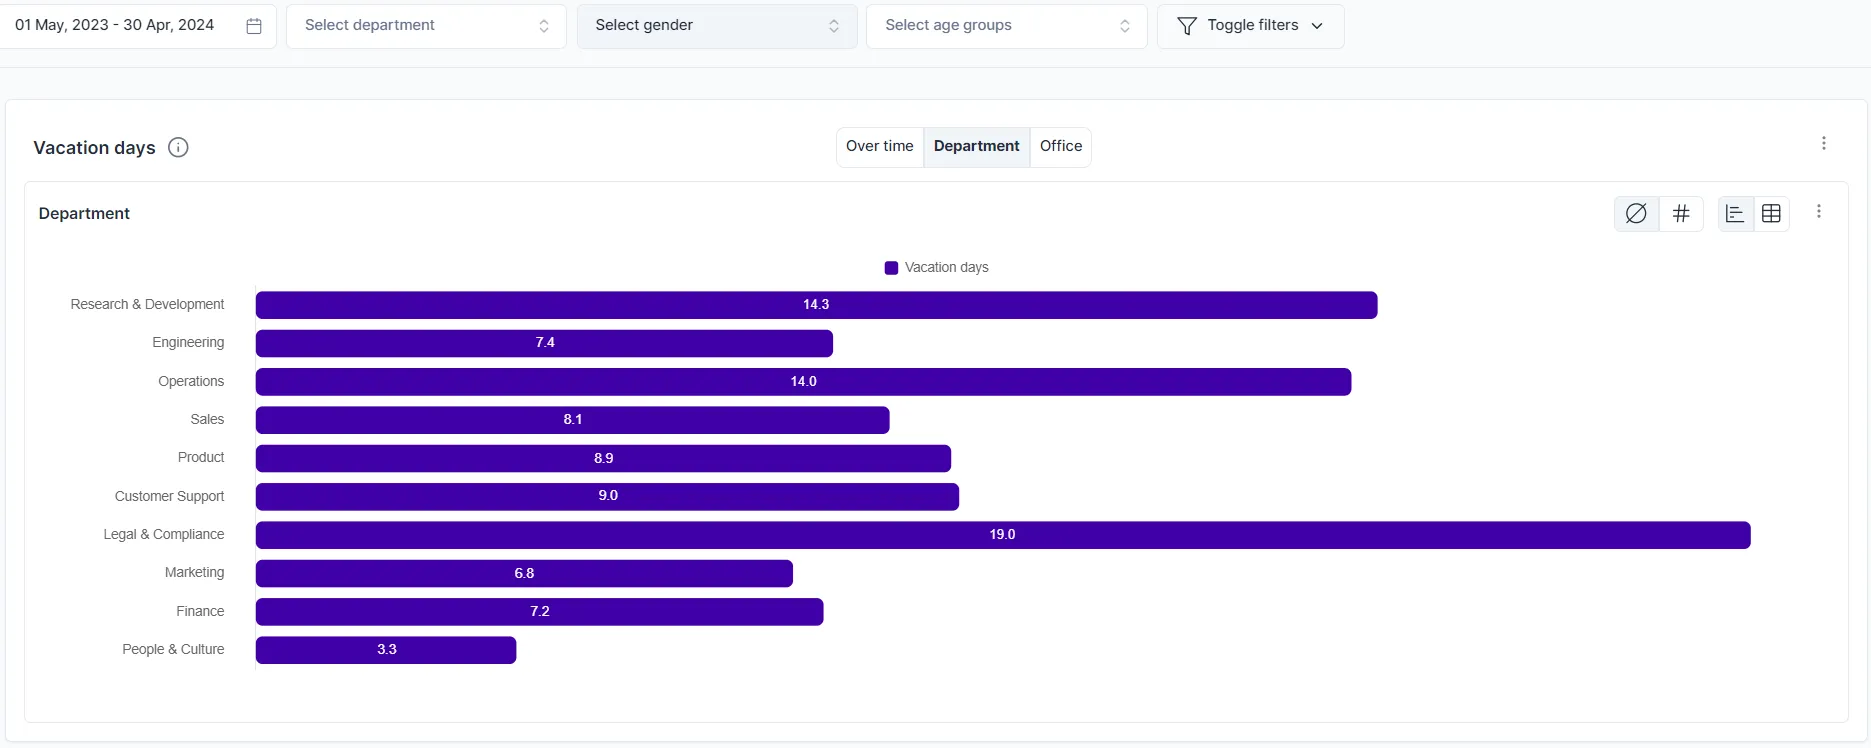
Vacation days: Total number of vacation days taken, paid or unpaid, over a specific period of time. Monitoring helps manage workforce availability and plan peak hours to maintain operational effectiveness.
Retention
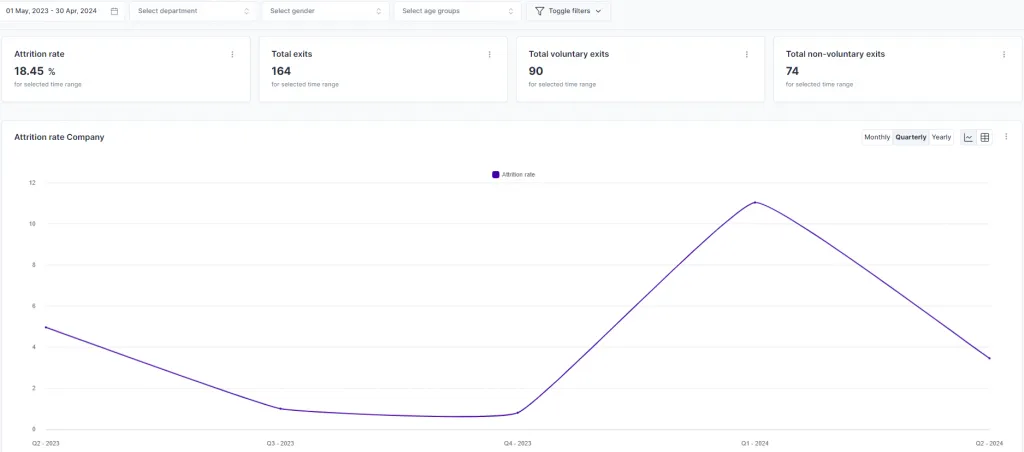
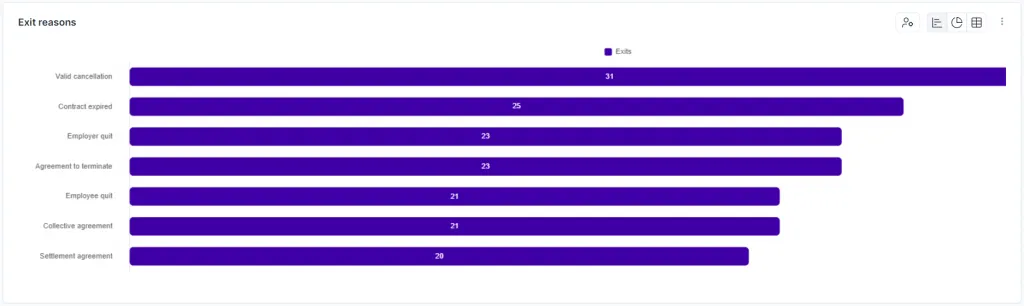
Turnover rate and reasons for quitting: The turnover rate is the percentage of employees who have left the organization within a period of time. Measurement is important to identify issues with employee satisfaction, engagement, and corporate culture, retain talent, and ensure workforce stability. It helps to manage recruitment and training costs and provides insights for effective personnel planning and budgeting. In addition, the analysis can identify systemic problems and competitive disadvantages, which enables targeted measures to improve organizational health and employee development.
Diversity, Equity & Inclusion
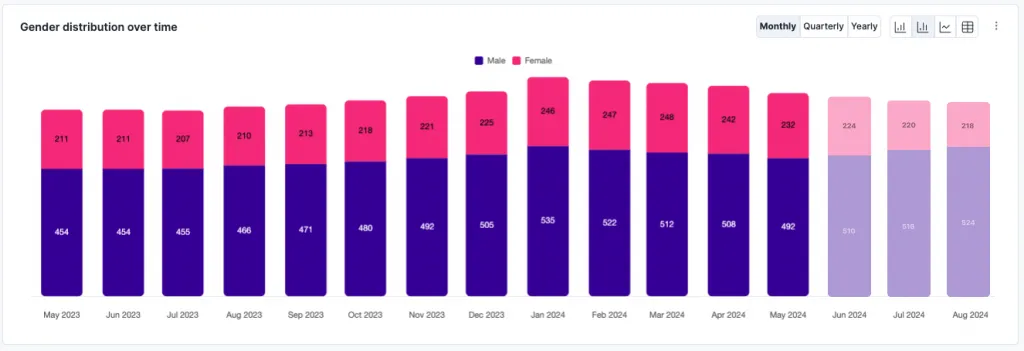
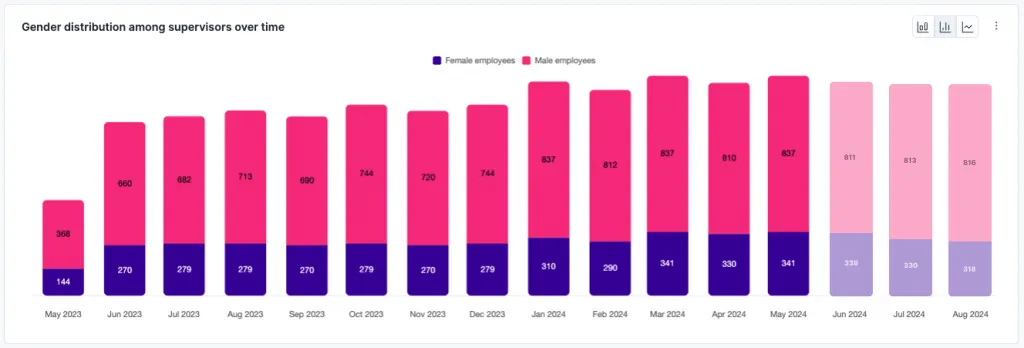
Gender distribution: Distribution and gender changes within the workforce over a period of time. Provides insights into trends in gender diversity, equality initiatives, and areas where gender imbalances exist.
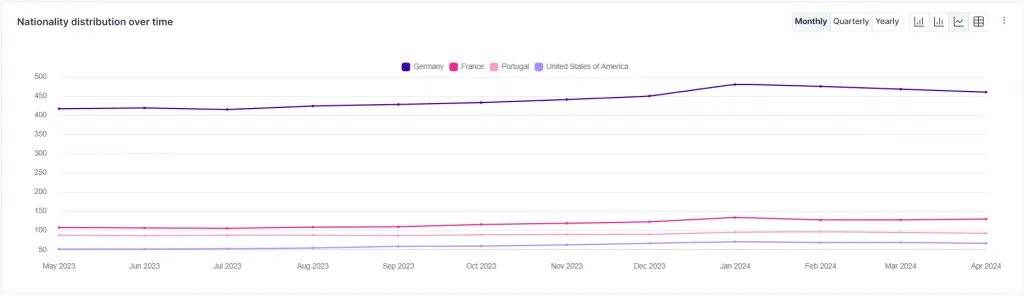
Nationality distribution: Composition of employees by nationality and how they changed over time. Monitoring helps to understand diversity levels and develop strategies for a more inclusive work environment.
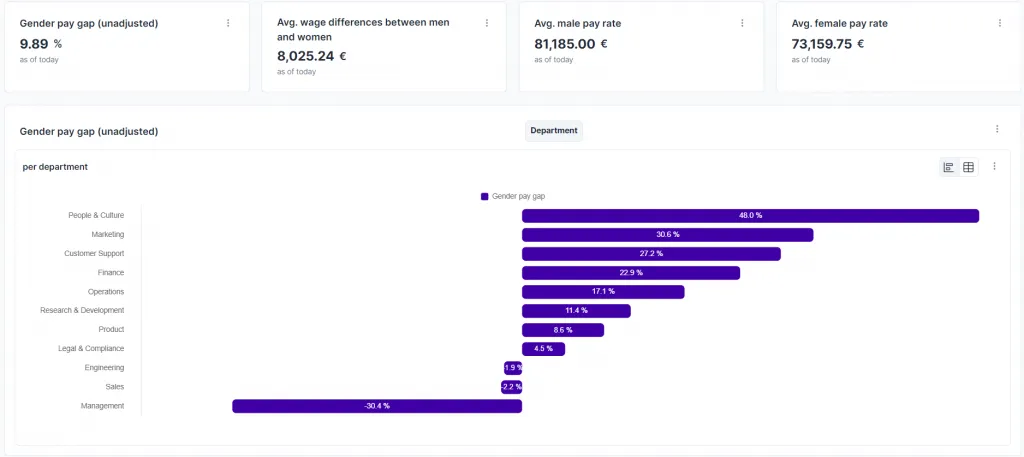
Gender pay gap: Measures the (unadjusted) difference in pay between women and men. The value is given as a percentage and shows how much fewer women earn on average compared to men. A significant gender pay gap may indicate problems with equal pay and discrimination, which can affect employee satisfaction, retention rates, and the reputation of the organization and may require political or HR measures.
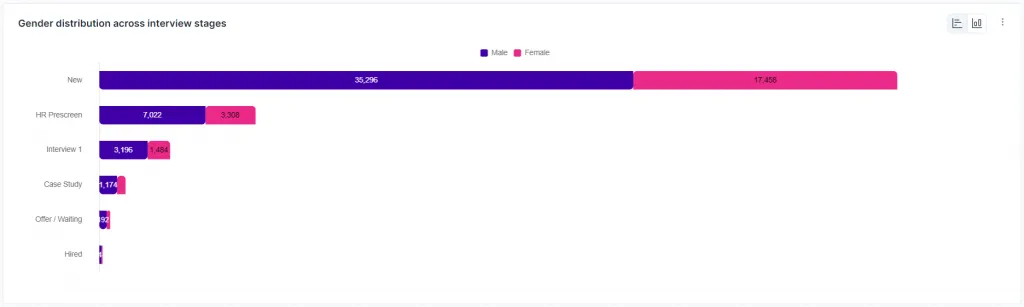
Gender distribution in the recruiting process: Applicants' genders at various stages of the application process. This monitoring helps to identify potential gender-specific biases or bottlenecks and promotes fairer personnel selection.
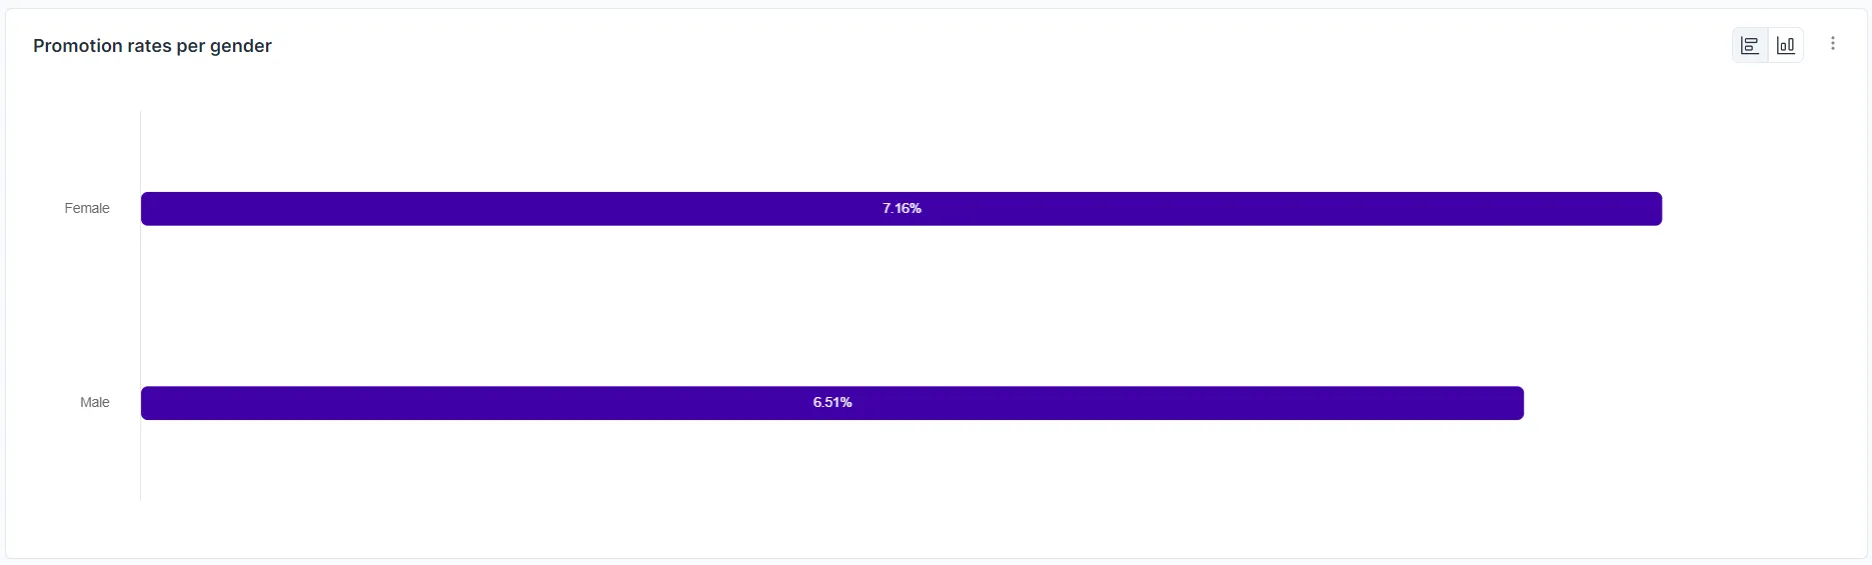
Promotion rates by sex: Proportion of employees of one gender who are promoted within a specific period of time This indicator helps the organization ensure fair career opportunities, identify inequalities in promotions and, where necessary, take organizational measures to promote fairness and inclusion.
What insights does this dashboard provide?
Yasmin's People & DEI dashboard for startups empowers people teams to gain insights into organizational effectiveness, retention of top talent and performers, and the impact of diversity, equity and inclusion initiatives. Using data visualization and analysis, the dashboard enables Yasmin to create awareness and transparency within the organization and gain management support for derived measures.
Awareness of the evolution of gender distribution over time helped Yasmin uncover hidden insights about biases in recruiting and employee retention that influence the organization's DEI strategy. For example, she found that the proportion of female employees leaving the organization has increased significantly in the short term. With reliable data, she created awareness and, together with department heads of the areas with the highest turnover of female employees, worked to understand the causes and initiate the right measures for recruiting and retention practices.